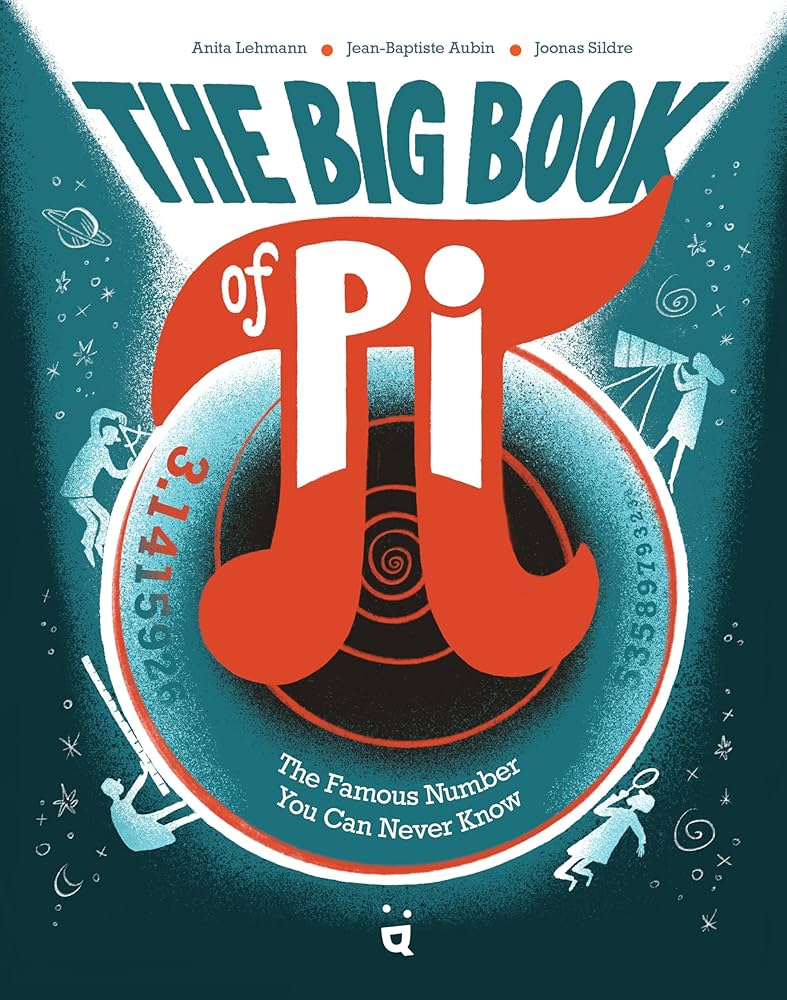
The Big Book of Pi: The Famous Number You Can Never Know by Anita Lehmann and Jean-Baptiste Aubin, illustrated by Joonas Sildre (Helvetiq, 88 pages, grades 4 and up). Divide the circumference of a circle by its diameter, and the answer will always be the same: an irrational number beginning with the digits 3.14. Medieval mathematicians called this number “the quantity which when the diameter is multiplied by it, yields the circumference” (only in Latin), but thankfully, an 18th century Welsh mathematician named William Jones changed the name to pi or π, as we like to say in Greek. But enough history, how about some cool pi tricks? Did you know that you can find your six-digit birthdate somewhere in pi’s digits (mine starts at the 172,406th decimal place. Don’t worry, I googled it.). Oh, and there are jokes: what do you get when a bunch of sheep stand in a circle? Shepherd’s pi. The final pages explains how little we still know about pi, despite advances in computer calculations, and reminds readers to stay curious and open-minded about learning about pi and other phenomena. Includes a glossary and a QR code for an educator’s guide.
Well, this was fun! I never expected a book about pi to be even a fraction this entertaining, but the chatty text, comic-style illustrations, and cool activities drew me in from the first page. Some of the math activities required a little too much brain power for me to pursue, but this only proves the wide range of readers that will find something to love about this book. Math teachers from grades 4 through high school (and beyond, really) will want to get their hands on this to add some engaging history and activities to classes.
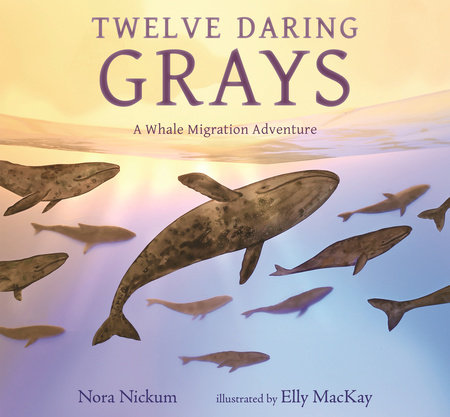
Twelve Daring Grays: A Whale Migration Adventure by Nora Nickum, illustrated by Elly McKay (Candlewick, 32 pages, grades 1-4). As a pod of 20,000 gray whales migrate from Baja California to the Arctic, a dozen of them make a detour to the Salish Sea off the coast of Washington. There they risk getting stranded in the shallow waters to feast on the ghost shrimp that live in the mud along the bottom of the sea. Since the whales eat almost nothing during their migration, this stop allows them to gain strength. A few weeks later, they rejoin the rest of their pod whose final destination is the Arctic. They spend the summer there before heading back south where their calves will be born. Includes an author’s note about these gray whales known as the Sounders that has grown from a pair that was first spotted in 1990 to larger group in this book.
The whales in this beautiful book look like they are about to pop off the page in the three-dimensional illustrations that portray them swimming and eating in gorgeous blue and gray waters. Readers will be filled with wonder about this small group of whales and the risky but rewarding side trip they take from their migration.