Published by HarperCollins
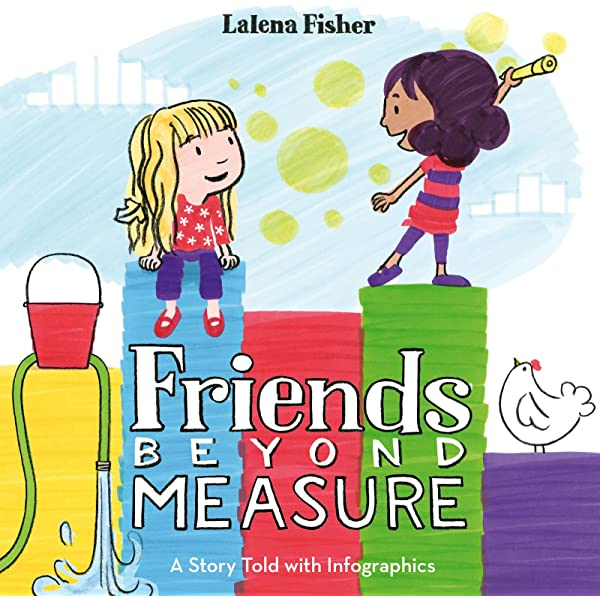
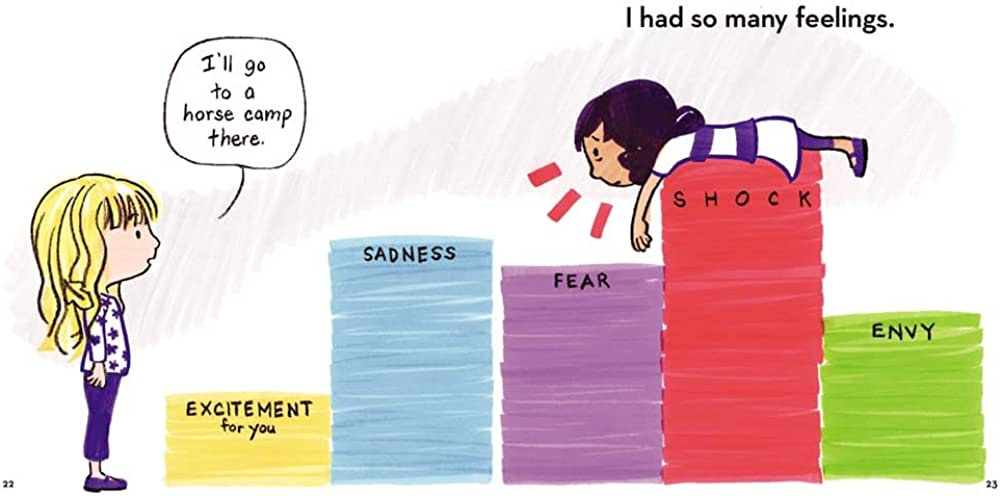
Summary: Ana and Harwin are best friends, a relationship that Ana likes to chart through infographics. She starts with a Venn diagram of the two girls, showing what is unique to them and what they have in common. Other charts and graphs show how they spend their time and how they work out disagreements. When Harwin announces she is moving far away, both girls are devastated. Ana shares her emotions through a bar graph, then makes a flowchart to weigh the consequences of packing herself in Harwin’s suitcase. The move goes ahead, but the two girls make plans (with charts) for staying in touch and for adventures they will have together when they’re older. Includes additional information on twelve different types of infographics. 40 pages; grades 1-4.
Pros: There’s a lot of mathematical information packed into this cute friendship story, providing a fun way to introduce infographics that could serve as a springboard for kids making their own.
Cons: This could be slow going as a group read-aloud since each page may require a lengthy explanation.

This sounds so unique! I want to check this book out
LikeLike